Road to recovery
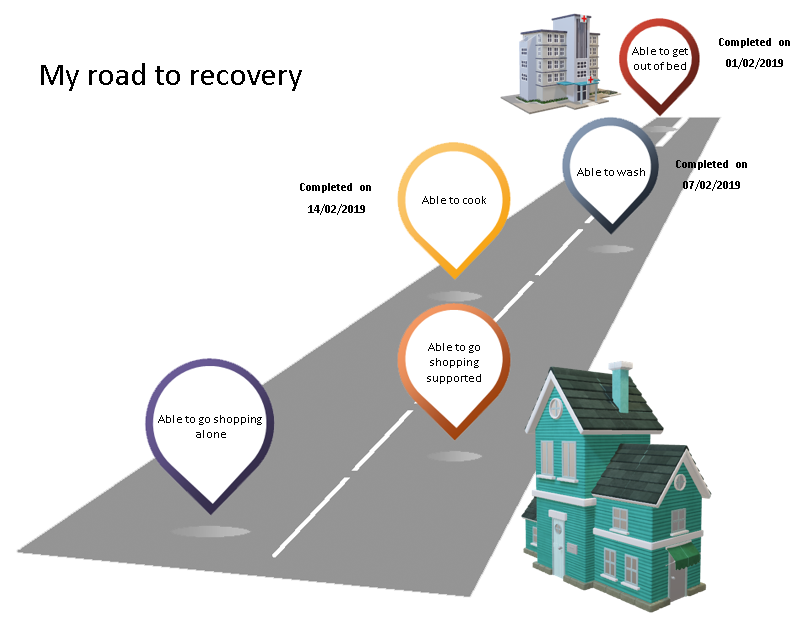
In this guide we are going to look at a basic assessment and use excel to represent the results for the service user. This example is looking at a Home from Hospital service which has set individuals goals with the service user. The results are added to an extension database and then a report is pasted into an excel template to produce the report below:
The Graphics
The graphics were created using Microsoft Excel, Microsoft Paint and Adobe Photoshop Elements.
The road was drawn with lines in MS Paint and filed, further lines were added up the centre of the road. Th bubbles were taken from a [Microsoft Excel Template] using the windows snipping tool. In Adobe Photoshop the magic tool was used to remove the backgrounds from the bubbles and then placed on the road. The graphic was then saved ready. The Hospital and House was inserted in Excel using the 3D models feature.
The Extension Database
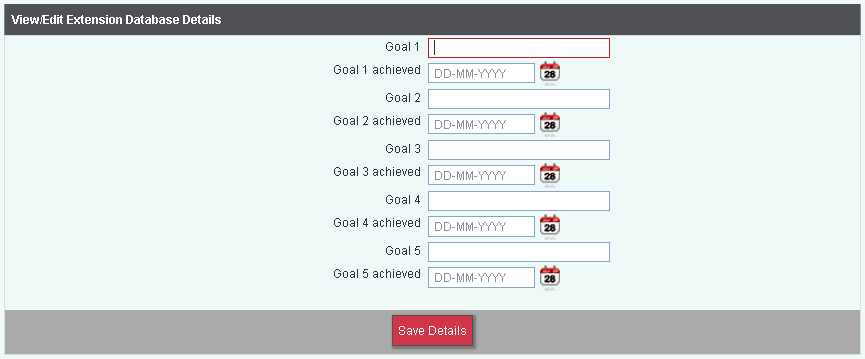
The extension data base has been created with 5 alphanumeric fields and 5 date fields, see Extension Database Setup for details. Below is the finished extension database:
The Extension Database Report
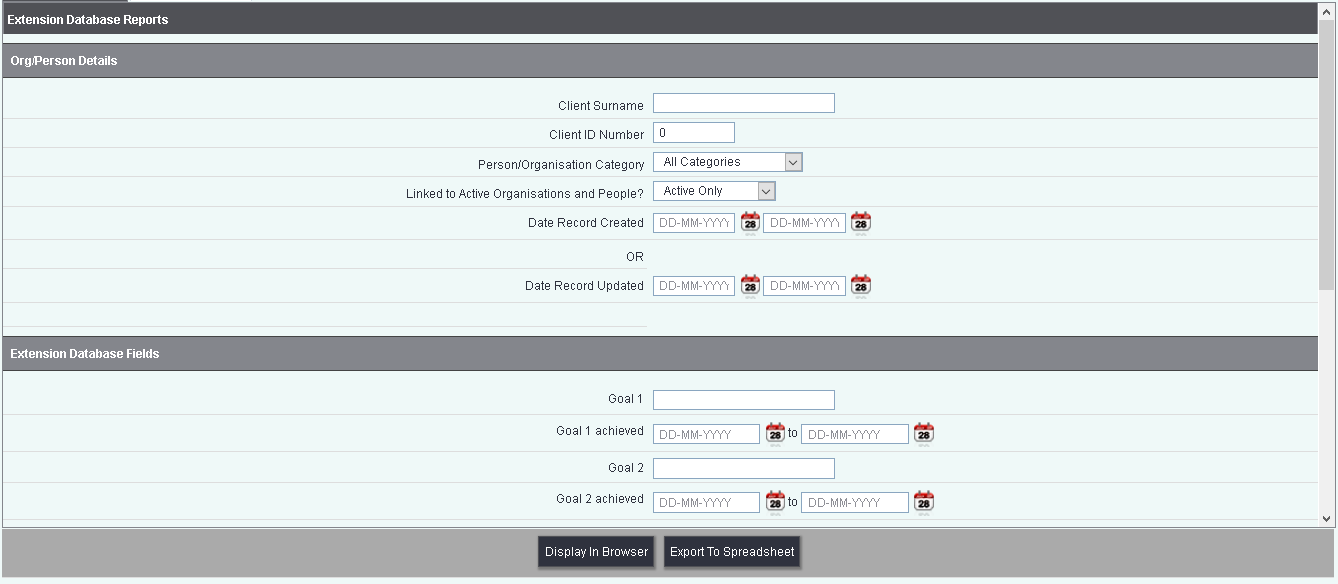
Via the reports menu select Extension Database Reports (under the Core heading). Click on the extension database you have created (in this example we called ours Road to Recovery). On the criteria screen enter the Clients ID number and select 'Export To Spread Sheet'.
The Excel Report
In the example spreadsheet there are 3 worksheets:
- Outcomes - This worksheet displays the graphic with the individual goals set and completed.
- Label Creator - This worksheet contains formulas to display a label if a date exists.
- Paste Date in A1 - Worksheet where the extension database report is pasted into A1.
We will look at the label creator first of all. We have used 5 columns to look at the date fields from the pasted data. A1 to E1 simply contain headings, Label for Goal 1 through to 5. In A2 we have the following formula:
=IF('Paste Data in A1'!F2>0,"Completed on","") - This formula basically says if their is a date in the pasted data field then give me a label of 'Completed on', otherwise leave the cell blank. This has been done for each of the date fields.
=IF specifies the formula and the condition and actions are placed in ().
'Paste Data in A1'! is the work book to look at and F2 is the cell.
>0 puts the condition is the source greater than 0.
, the first comma specifie what to do if the condition is correct, in this case it displays the text Completed By (needs " each side of the text).
, the second comma specifies what to do if the condition is incorrect, we have used 2 x " to give us a blank.
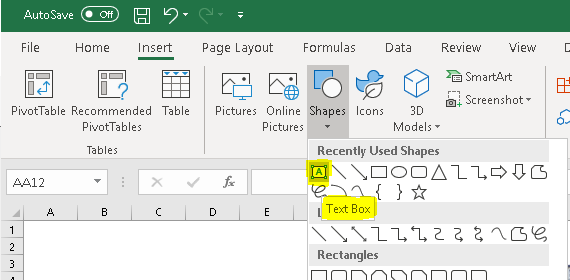
The Outcome worksheet has had the graphic inserted as a picture and resized to the required size. Using the text box (Shapes on the insert tab) we have then drawn text boxes in the required locations, each goal, label and date.
To enter the formula into each text box you need to do the following process.
- Select the text box.
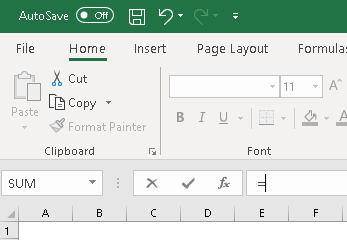
- Click in the formula bar and type =
- Using the mouse find the relevant label for each label text box on the Label Creator worksheet, relevant date from the Paste Data in A1 worksheet and relevant goal from the same sheet.
- Press enter.
The final stage is to copy the data from the report ran and paste this in to Cell A1 of the 'Paste Data in A1' worksheet. When you return to the Outcomes worksheet it will appear with the goals set and any dates completed.
[Please click here to down load the example form]

